
11 Best Tableau Books
The best Tableau books, ranked by how many expert sources recommend each one, with notes on who they suit for learning analysis, dashboards, and design.
Our take
Tableau books can help with two different challenges: learning how to build a visualization and deciding what it should communicate. Some guides follow a sequence from data connections to dashboards, while others work better as references for a particular analytical problem. Design books add another perspective by asking whether the result helps an audience understand the data. Choose according to the part of that process you find hardest.
Visual Analytics with Tableau offers an approachable entrance for business users. Practical Tableau favors techniques you can practice separately, while Tableau Strategies connects examples to analytical questions. Communicating Data with Tableau and The Big Book of Dashboards give more attention to presentation and audience needs. Several tutorials here target older releases, so expect menus and screenshots to differ from a current installation. Start with Visual Analytics with Tableau for foundations, then use Practical Tableau or Tableau Strategies alongside your own workbooks.
11 books · 8 sources · Last updated
As an Amazon Associate, we earn from qualifying purchases (at no extra cost to you).
How to choose from this list
Skip to the full rankingIf you’re new to visual analysis: Visual Analytics with Tableau
If you want practical techniques: Practical Tableau → Innovative Tableau
If you want to solve analytical problems: Tableau Strategies
If you want clearer dashboards: Communicating Data with Tableau → The Big Book of Dashboards
If you want advanced reference material: Mastering Tableau 2021
The 11 books, ranked
Ranked by how many expert sources name each book. Ties go to the book more people recommend.

For users who prefer practical techniques they can apply one at a time. Its collection format supports targeted practice across visualization and dashboards, though it provides less of a continuous course than a structured beginner guide.
What it's about
Ryan Sleeper presents 100 Tableau tips, tutorials, and strategies for developing interactive visualizations. The guide moves from fundamentals and chart construction to parameters, color, workbook performance, dashboard development, and practical storytelling techniques that help communicate insights from data.
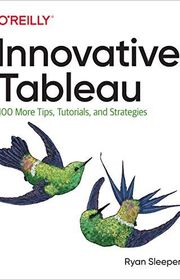
Innovative Tableau
For users who want more techniques after building basic workbooks. Its short tutorials encourage experimentation with interaction and presentation, though they work best alongside practice and some software details have changed since publication.
What it's about
Ryan Sleeper presents one hundred additional Tableau tips and tutorials covering interactive features, visualization design, analysis, and dashboard techniques. Examples explain how particular choices can make a workbook easier to explore and communicate its findings more clearly.

Visual Analytics with Tableau
For business users who want visual analysis without starting from a programming background. Its illustrated progression makes core tasks approachable, though experienced developers may want a more specialized treatment of advanced calculations and dashboard engineering.
What it's about
Alexander Loth introduces Tableau's visual analytics workflow through illustrated, step-by-step guidance. Topics include connecting and preparing data, constructing charts and dashboards, calculations, forecasting, and integration with analytical tools, with material designed for readers without a programming background.

Communicating Data with Tableau
Designing, Developing, and Delivering Data Visualizations
For analysts who can make charts but want to communicate a clearer message. Its focus on comparisons, rates, and uncertainty gives design decisions a purpose, though the Tableau examples use a much older interface.
What it's about
Ben Jones connects data-communication principles with hands-on visualization techniques using Tableau Desktop and Public 8.1. The guide explains how to present comparisons, proportions, averages, rates, and uncertainty, creating visualizations that convey findings or invite viewers to explore data.
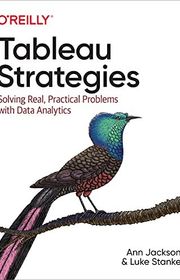
Tableau Strategies
For analysts who want to choose a solution for a concrete data problem rather than browse isolated tricks. Its case-based structure connects purpose with implementation, though the substantial examples demand active work and familiarity with Tableau.
What it's about
Ann Jackson and Luke Stanke organize Tableau techniques around practical analytics problems. Case studies cover categorical, quantitative, geospatial, statistical, and other forms of analysis, connecting the reason for a visual approach with the steps needed to build it.

For readers who want both individual analysis and the wider process of sharing work across an organization. Its broad Desktop and Server perspective provides context, though older release details need verification before applying them.
What it's about
Daniel G. Murray guides readers through visual analysis with Tableau, from connecting data and constructing charts to publishing dashboards. Practical examples connect Desktop and Server workflows with organizational uses of analytics, helping readers develop visualizations and share findings across teams.
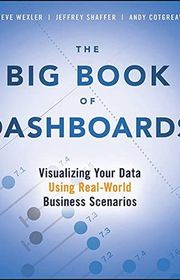
The Big Book of Dashboards
For readers who want to judge whether a dashboard answers its audience’s questions. Its business scenarios explain design tradeoffs more directly than a software manual, though it does not teach every Tableau construction step.
What it's about
This book examines dashboards through real business scenarios from different industries and departments. The authors discuss how chart choices, layout, interaction, and audience needs affect whether a dashboard helps people understand data and make decisions.

Getting Started with Tableau 2019.2
Effective Data Visualization and Business Intelligence With the New Features of Tableau 2019.2
For newcomers working with an older Tableau installation or studying established workflows. Its example-led progression offers a focused introduction, though the explicit 2019.2 version makes it less suitable as a current feature reference.
What it's about
Tristan Guillevin introduces Tableau 2019.2 through examples of its features and core workflows. Readers connect and prepare data, construct visualizations and dashboards, publish their work, and progress to techniques including data blending and joins across different databases.

Learning Tableau 2020
For beginners who want a structured progression from connecting data to interactive analysis. Its broad sequence is useful for systematic study, though this edition targets Tableau 2020 and interface details need checking against current documentation.
What it's about
Joshua N. Milligan teaches Tableau 2020 through a progression from data connections and basic charts to interactive dashboards and advanced analysis. The guide covers calculations, geographic visualization, Tableau Prep, and storytelling, connecting technical features with communicating findings from data.

Tableau Dashboard Cookbook
For readers who learn through dashboard examples and want a connected development process. Its practical format links individual features with delivery decisions, though the older software version limits its value for matching today’s menus.
What it's about
Jen Stirrup follows the process of creating Tableau dashboards from an initial data source through design and delivery. Sequential examples explain dashboard elements and software features, connecting visualization theory with practical decisions for business users and developers.

Mastering Tableau 2021
Implement Advanced Business Intelligence Techniques and Analytics with Tableau
For experienced users who want advanced analysis and integrations gathered into one guide. Its breadth makes a useful reference after the basics, though the Tableau 2021 focus means screenshots and supported workflows may differ today.
What it's about
Marleen Meier and David Baldwin explore advanced Tableau 2021 techniques for business intelligence and analytics. Examples cover complex dashboards, geographic and time-series analysis, data preparation, and integrations with Python and R, alongside approaches to publishing and improving visual presentations.
Sources
- 1
Tableau Books
educba.com
- 2
5 Best Tableau Books for Data Visualization and Data Analysis
programmingcube.com
- 3
The 8 Best Tableau Books Based on Real User Reviews
solutionsreview.com
- 4
Tableau Books
goodreads.com
- 5
Our Visual Analytics Books
playfairdata.com
- 6
Want a book recommendation
reddit.com
- 7
Book recommendation
reddit.com
- 8
12 Great Books About Data Visualization
tableau.com





Edited by
Software engineer whose passion for tracking book recommendations from podcasts inspired the creation of MRB.
Lead investor at 3one4 Capital whose startup expertise and love for books helped shape MRB and its growth.
Comments
Spotted a missing book, a wrong order or a mistake? Tell us and we'll fix this page.
We're a reading guide, not the author or publisher, so we can't send books or pass on messages.